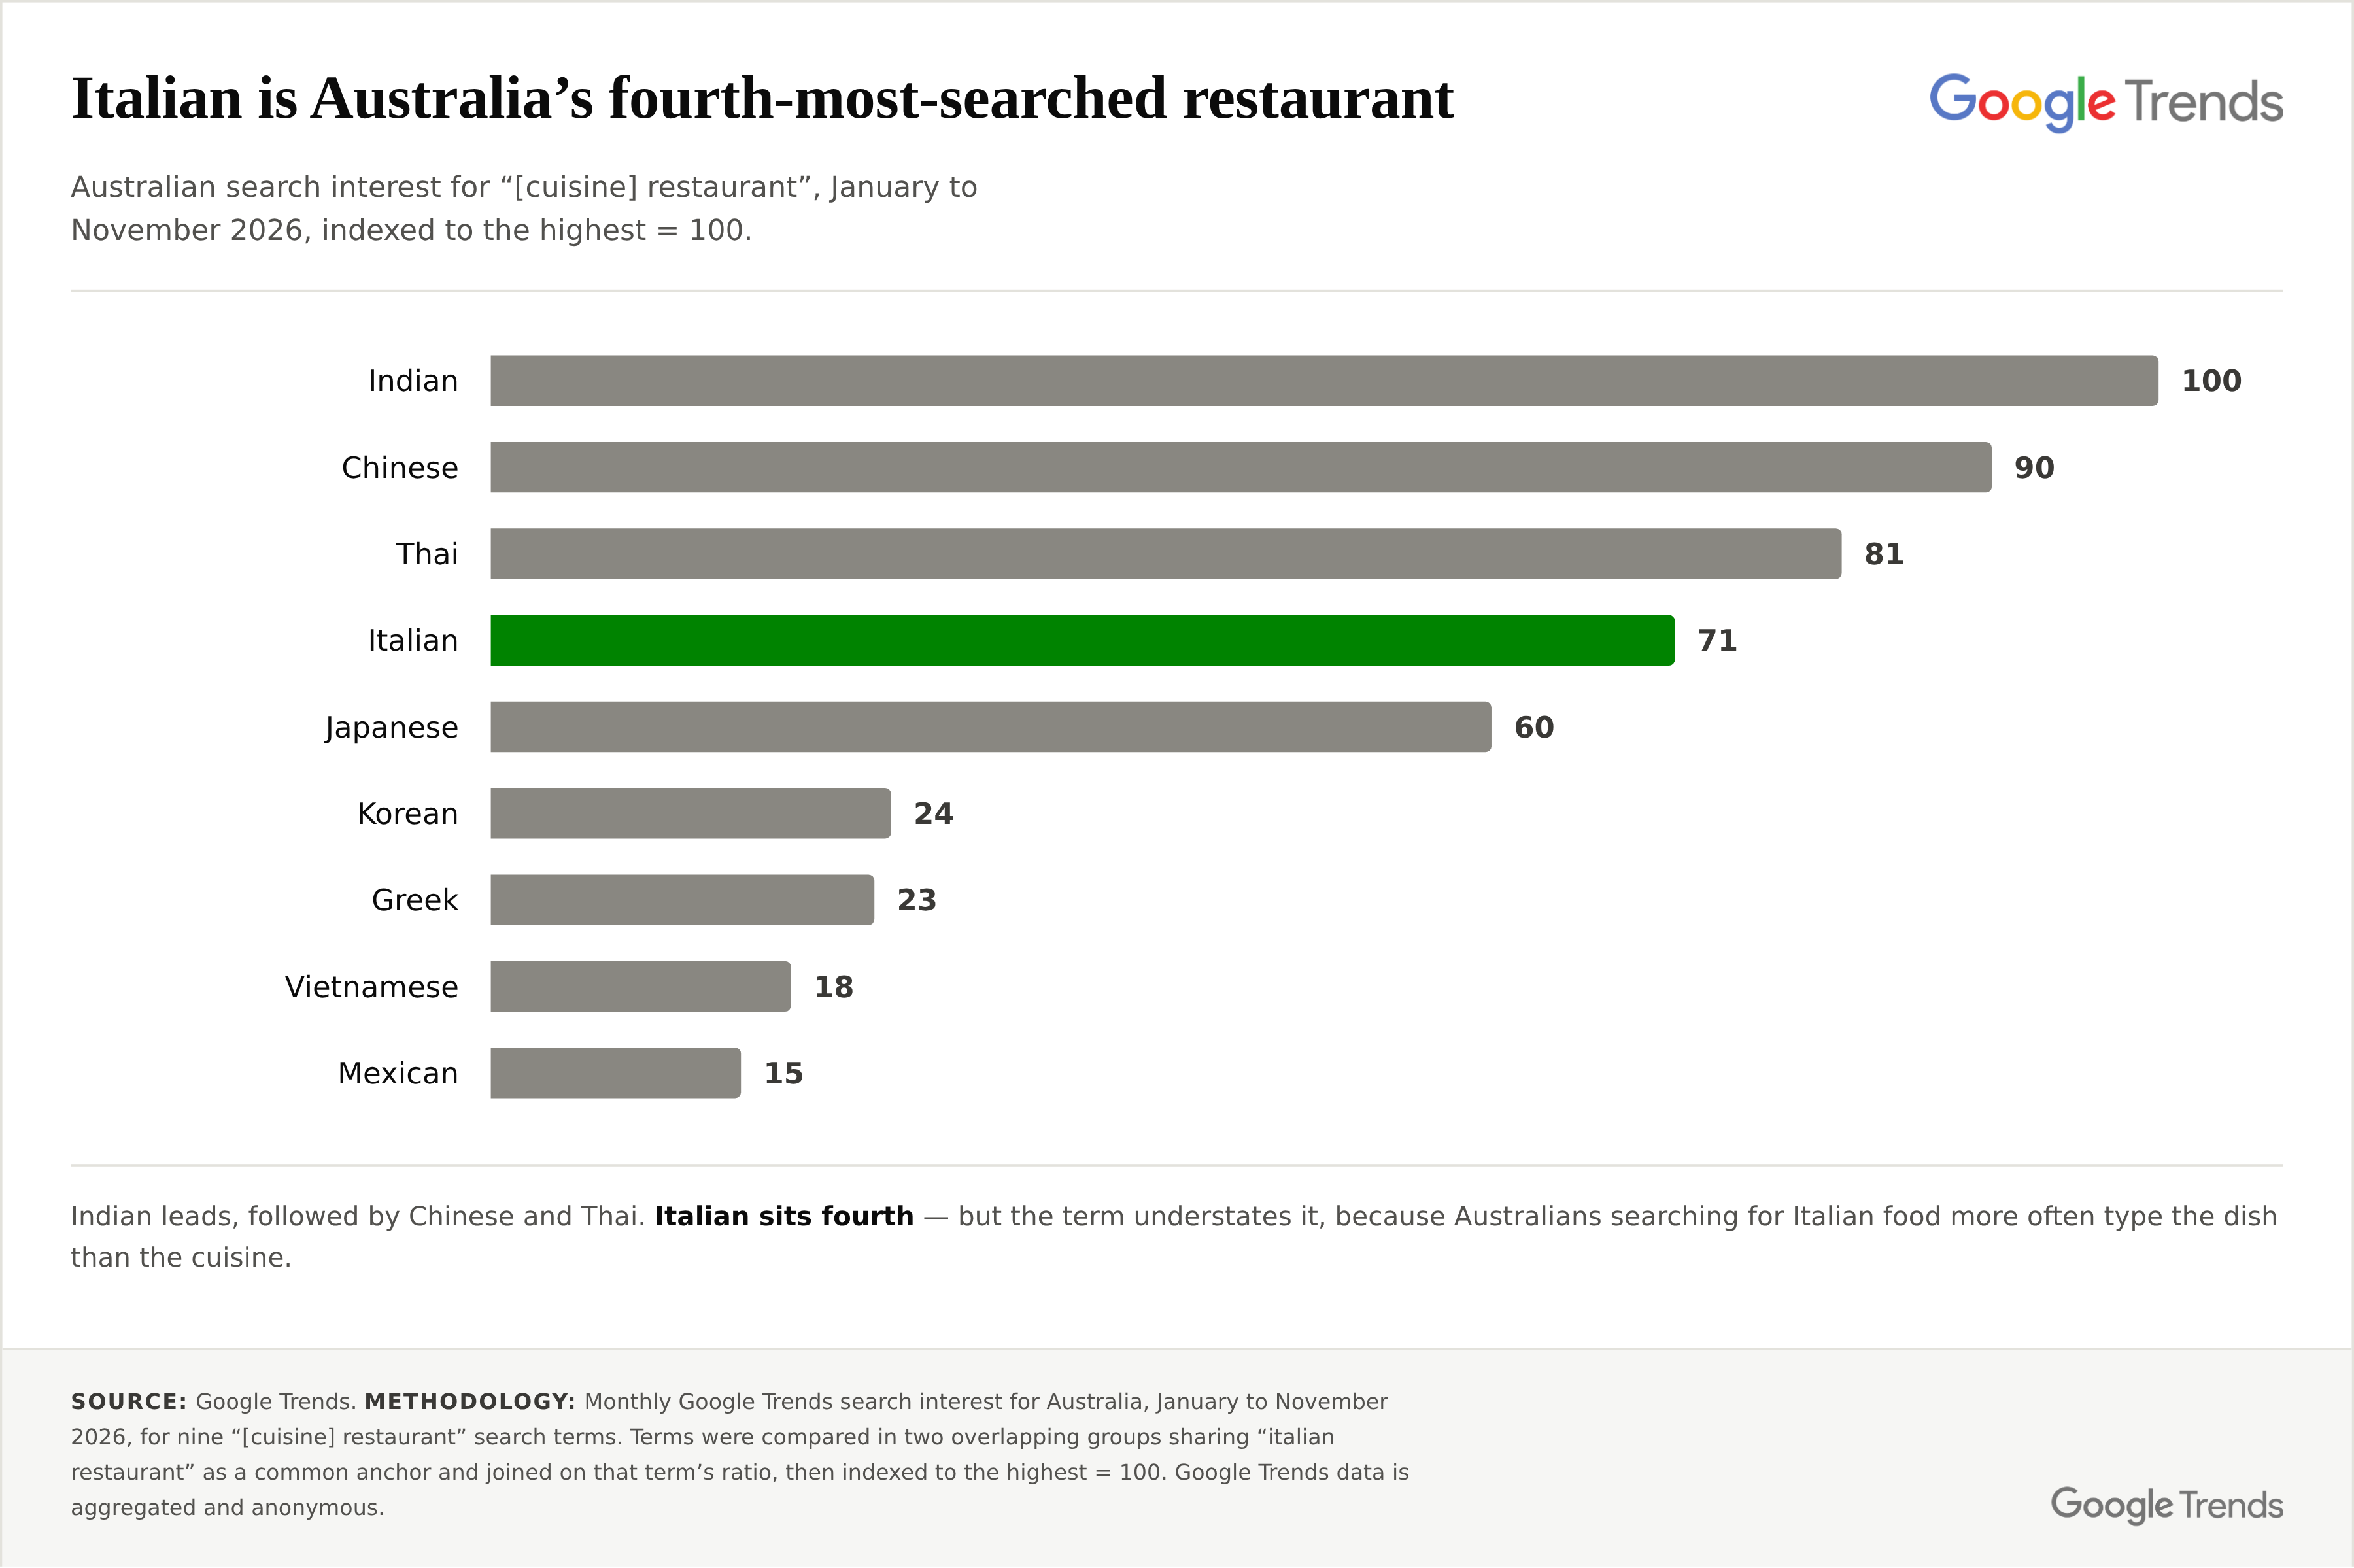
Ask Google Trends which cuisine Australians search for most and the answer is not the one an Italian publisher would hope for. Over the first eleven months of 2026, “indian restaurant” drew the most Australian search interest, followed by Chinese and Thai. Italian came fourth.
Figure 1: Australian search interest for nine “[cuisine] restaurant” terms, January to November 2026. Source: Google Trends.
Japanese is fifth. Then a considerable gap, and a second tier: Korean, Greek, Vietnamese and Mexican, each at roughly a fifth of Indian’s level.
Why the league table flatters everyone but Italian
There is a reason to treat that ranking with suspicion, and it is a reason that cuts only one way. Searching “indian restaurant” is how most Australians look for Indian food. Searching “italian restaurant” is not how most Australians look for Italian food, because Italian food in Australia has been naturalised into its individual dishes. People search for pizza. They search for pasta. They search for the name of the place down the road.
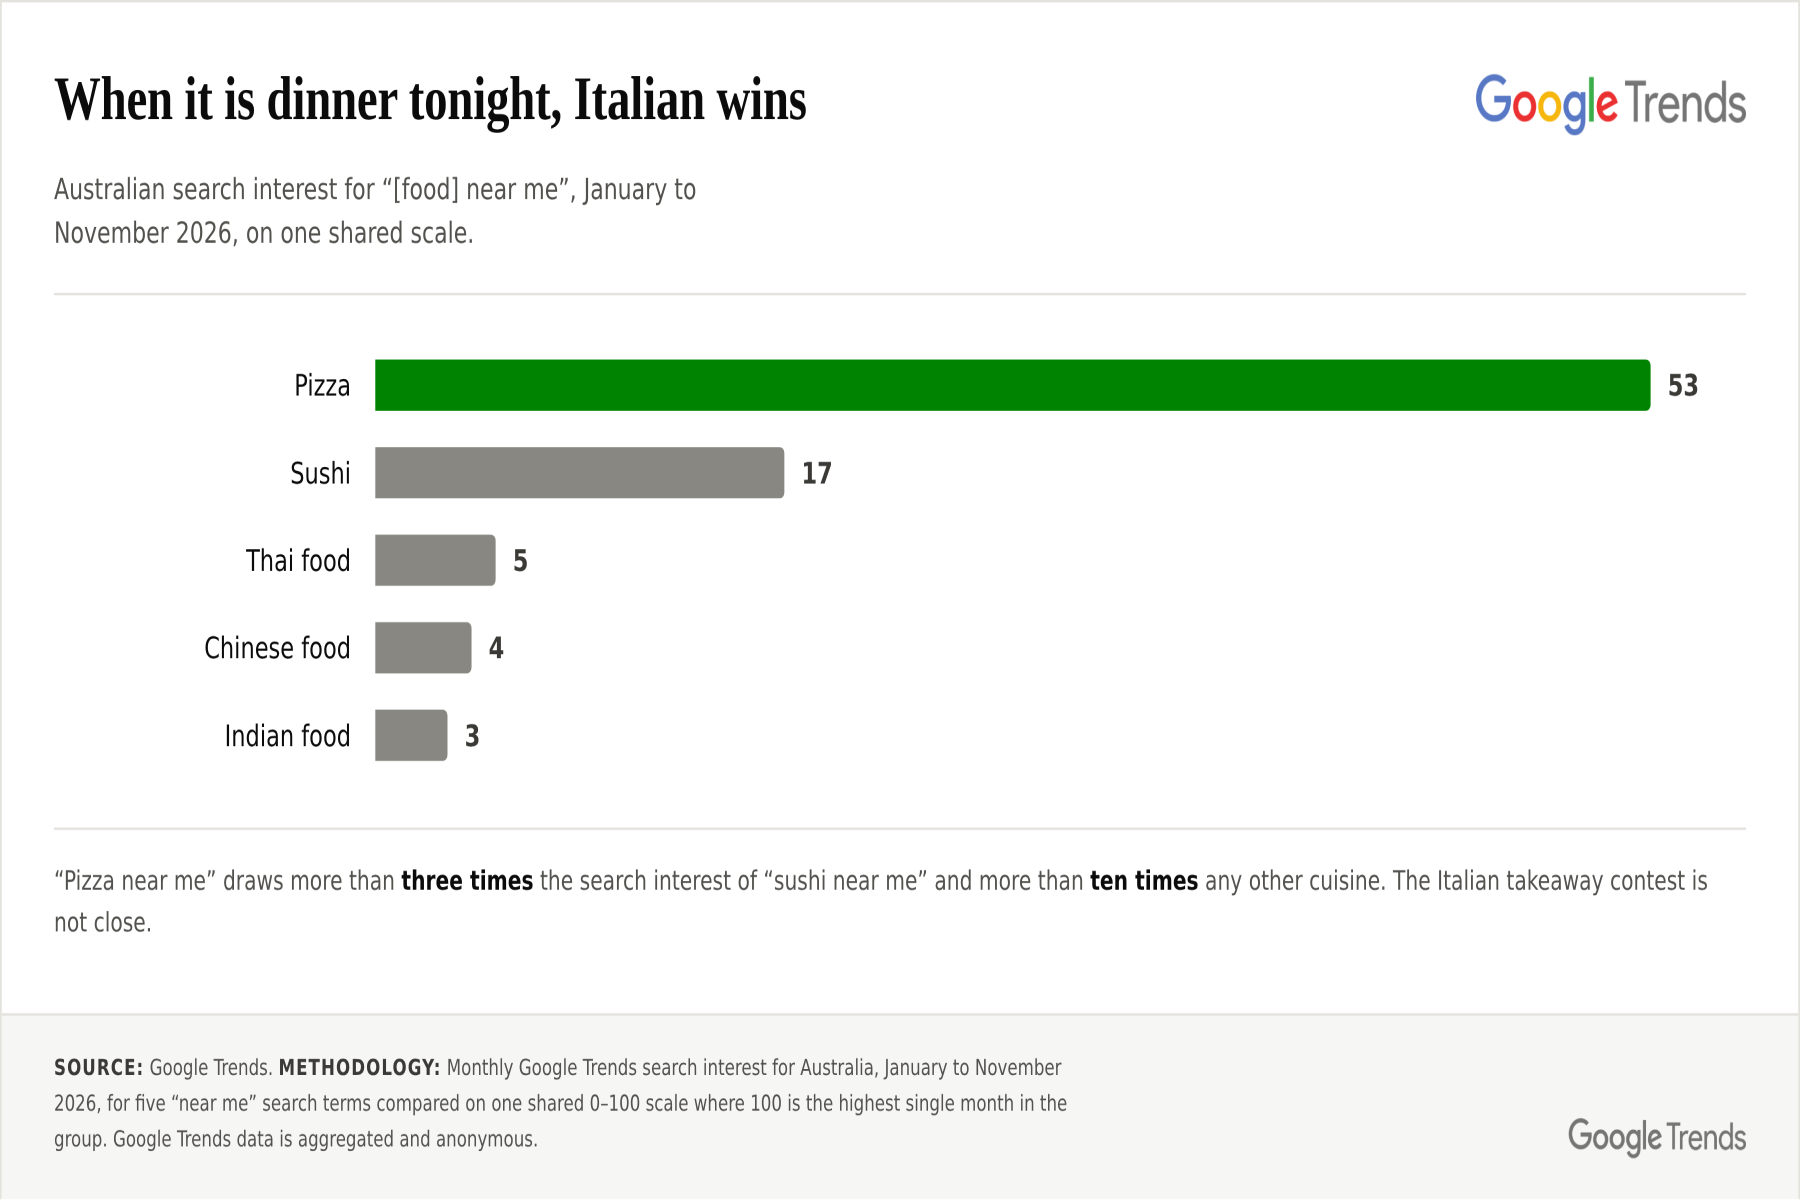
Change the question from “where is a restaurant of this type” to “what am I eating tonight” and the order inverts completely.
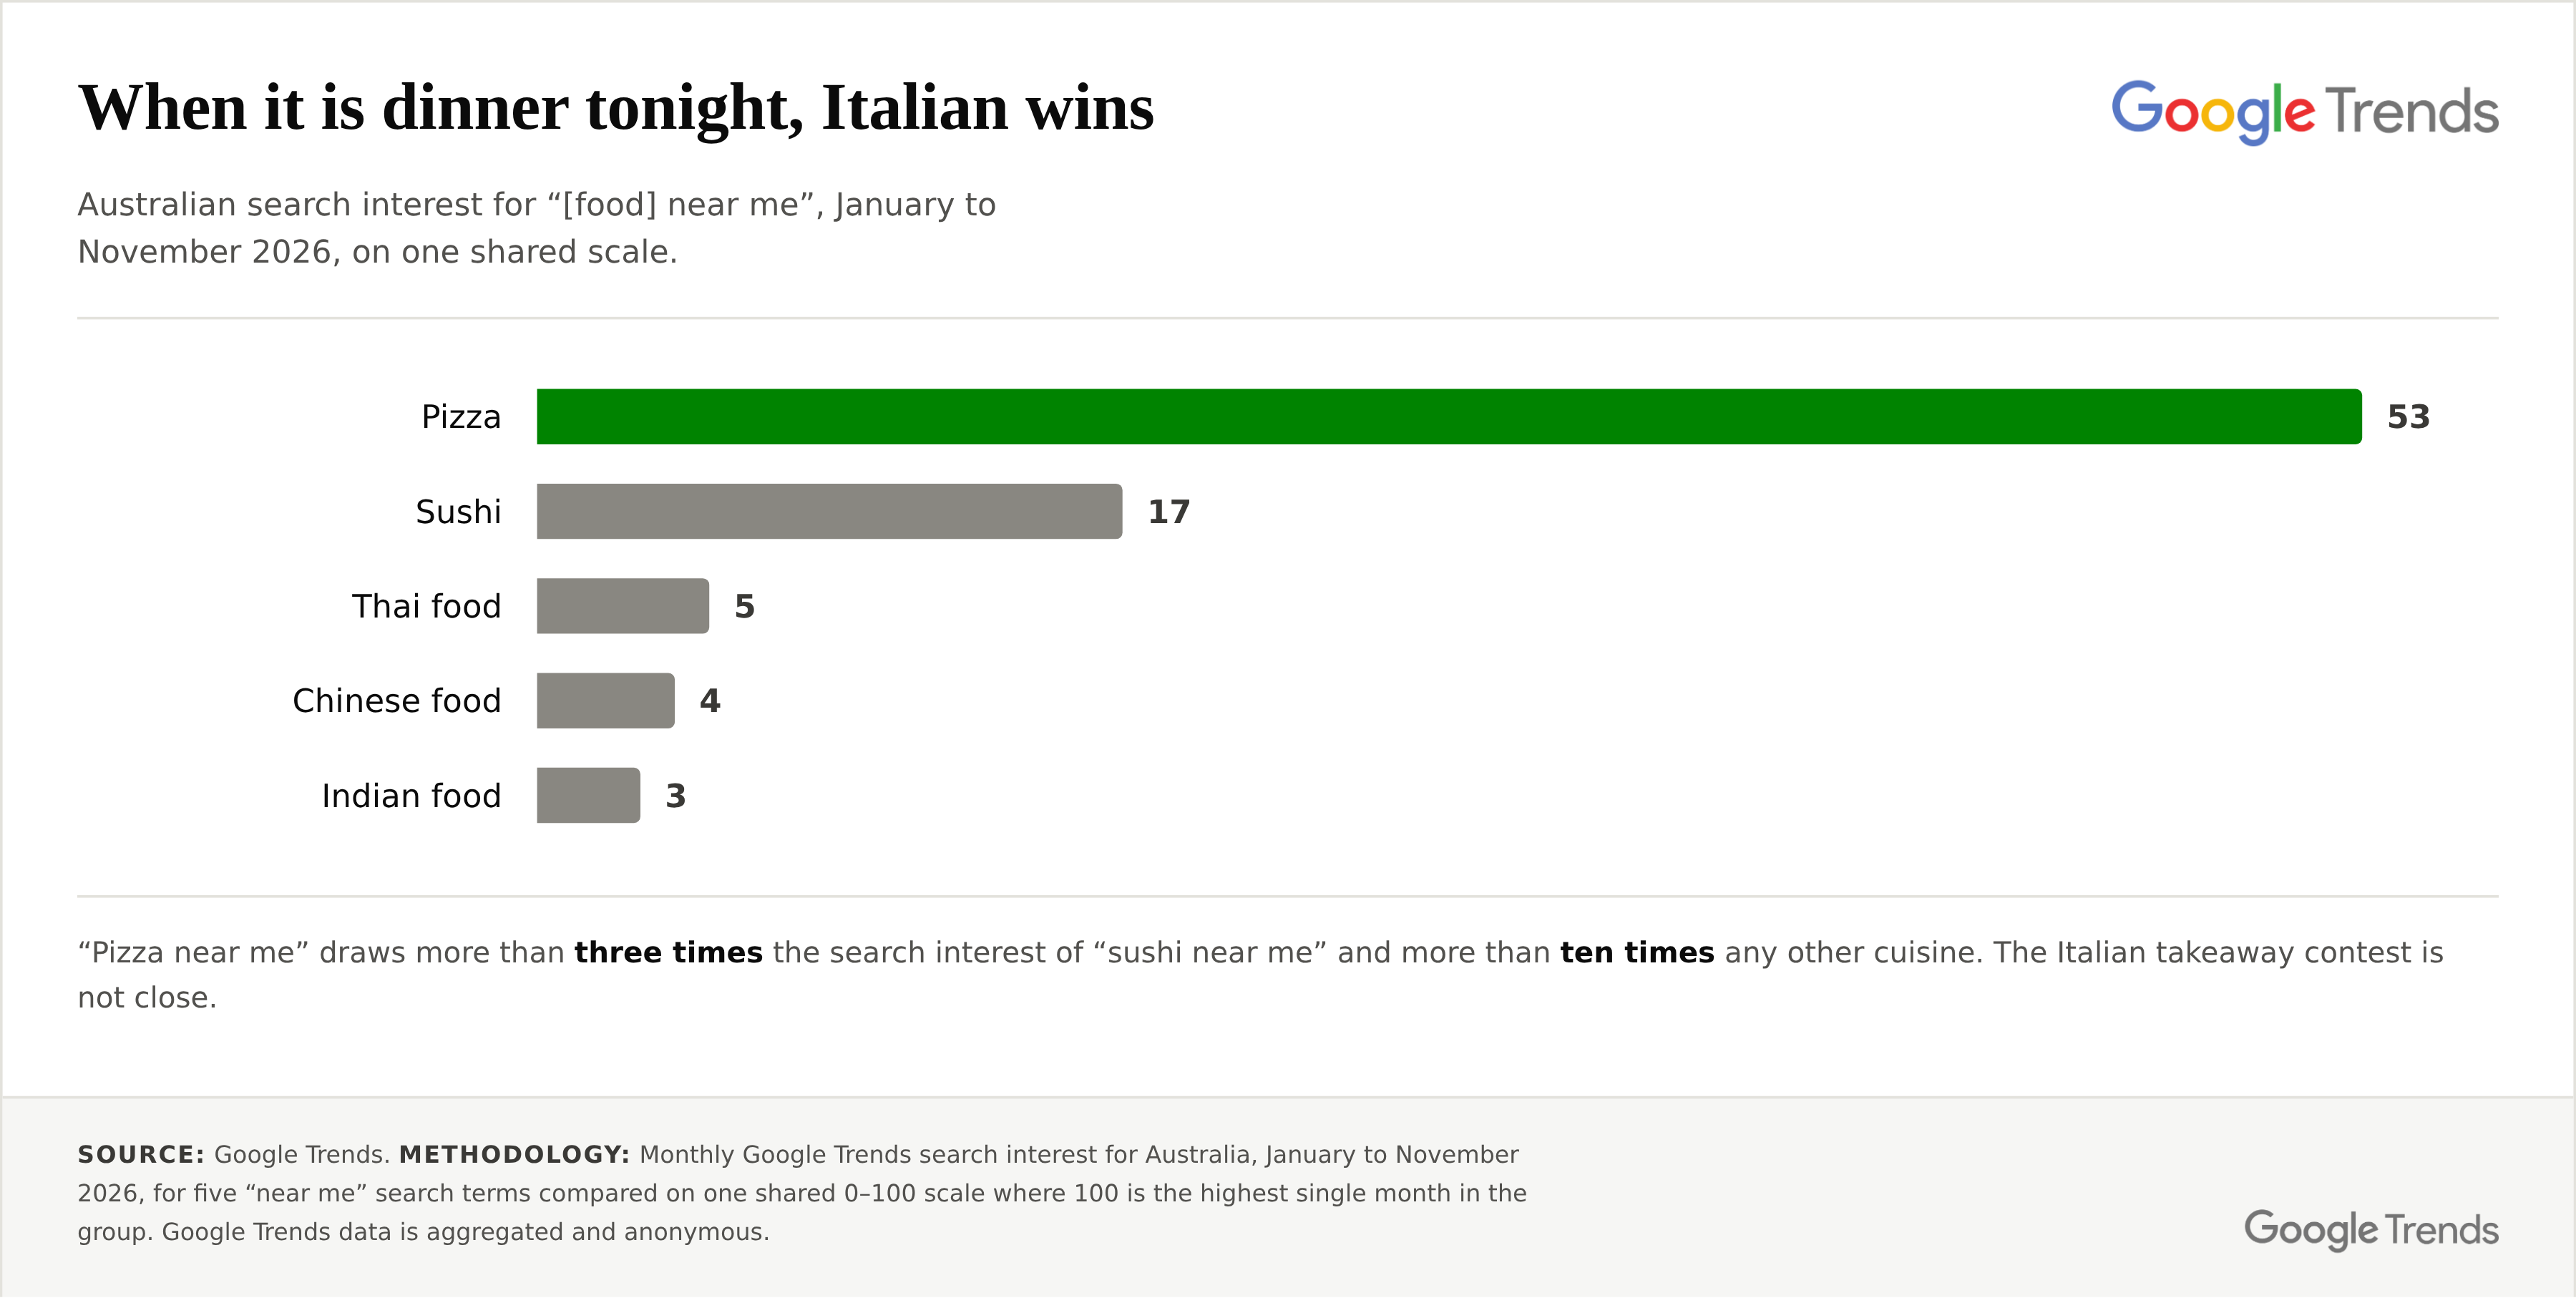
Figure 2: Australian search interest for “[food] near me”, January to November 2026. Source: Google Trends.
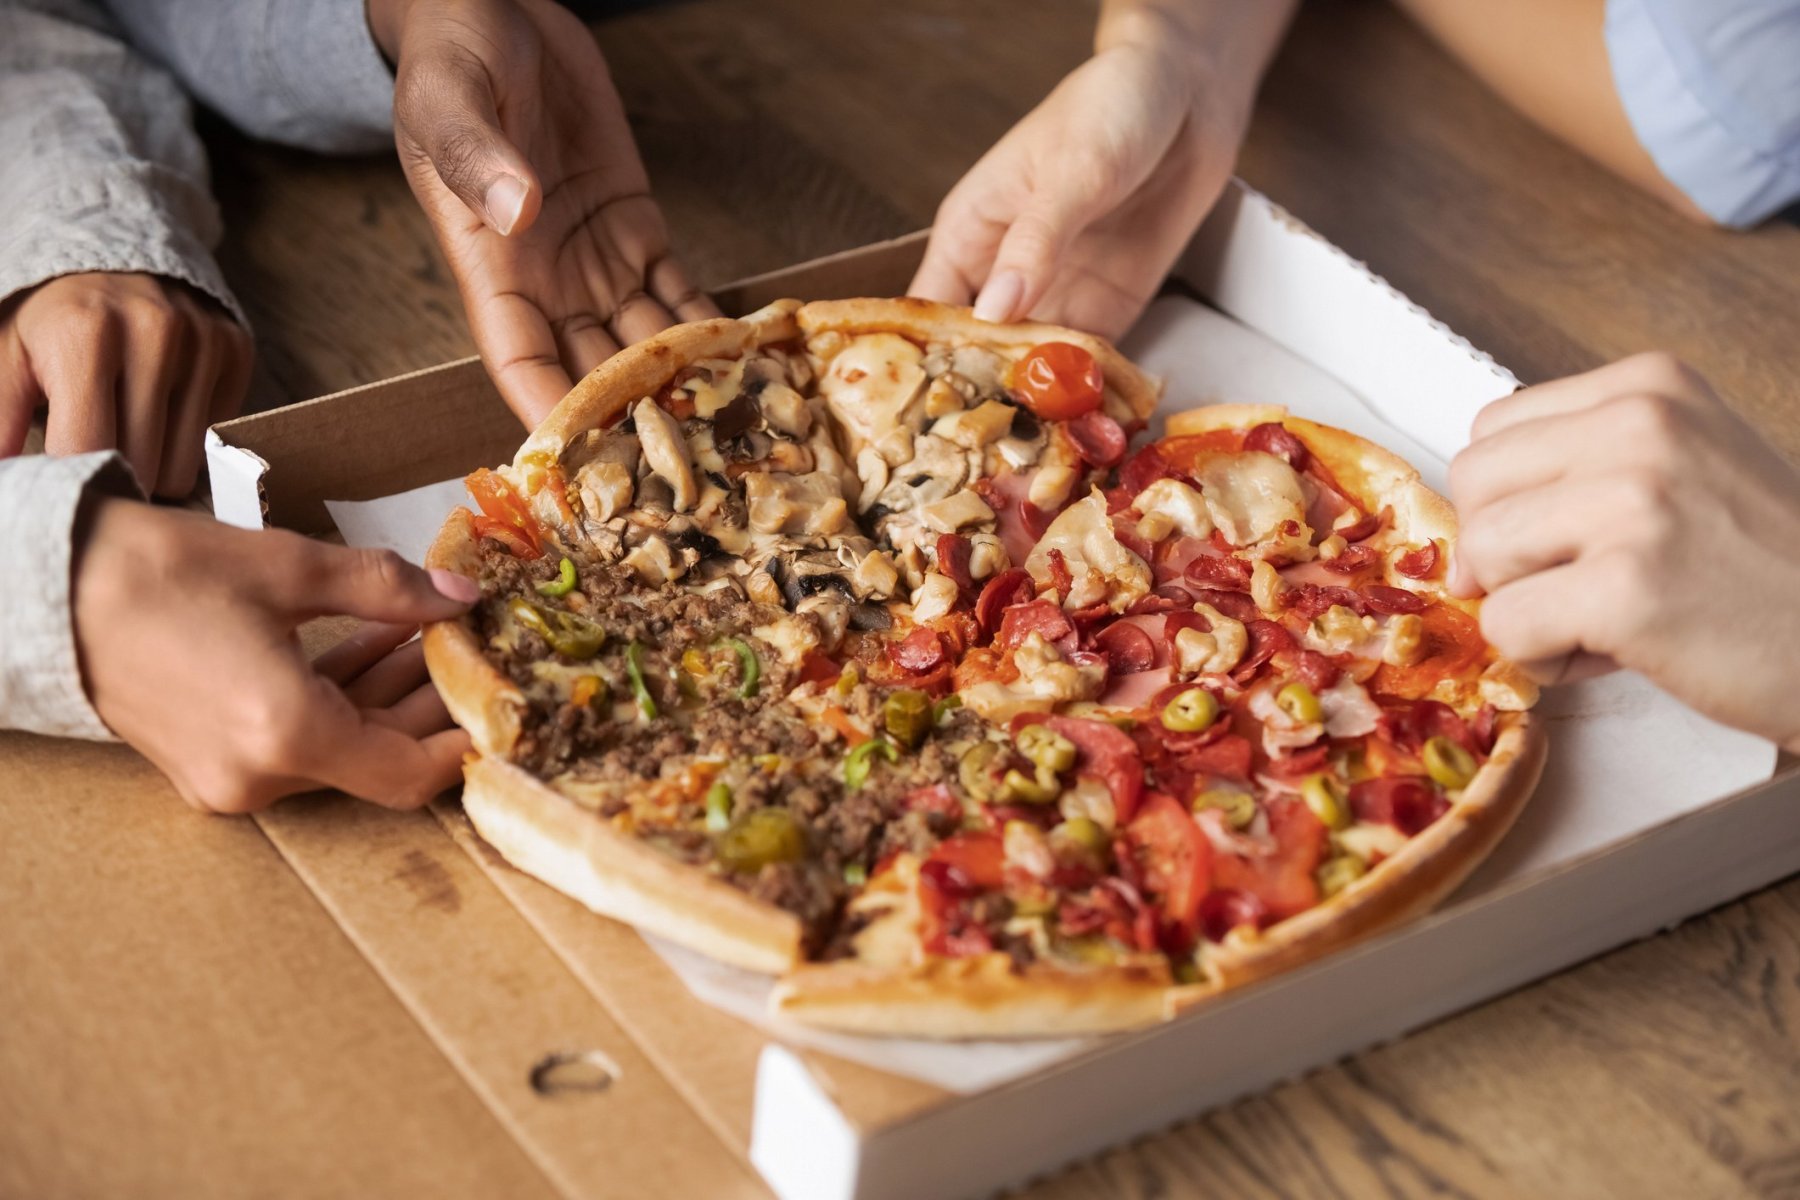
“Pizza near me” draws more than three times the search interest of “sushi near me”, and more than ten times “thai food near me”, “chinese food near me” or “indian food near me”. It is not a close contest. When Australians want food brought to them or picked up on the way home, the default is Italian — they just do not call it that.
Every cuisine has a December
The seasonal question produces the most consistent finding in the whole dataset: every cuisine peaks in December and January, and every cuisine troughs in March. The holidays lift eating out; the return to school and work puts it down again.
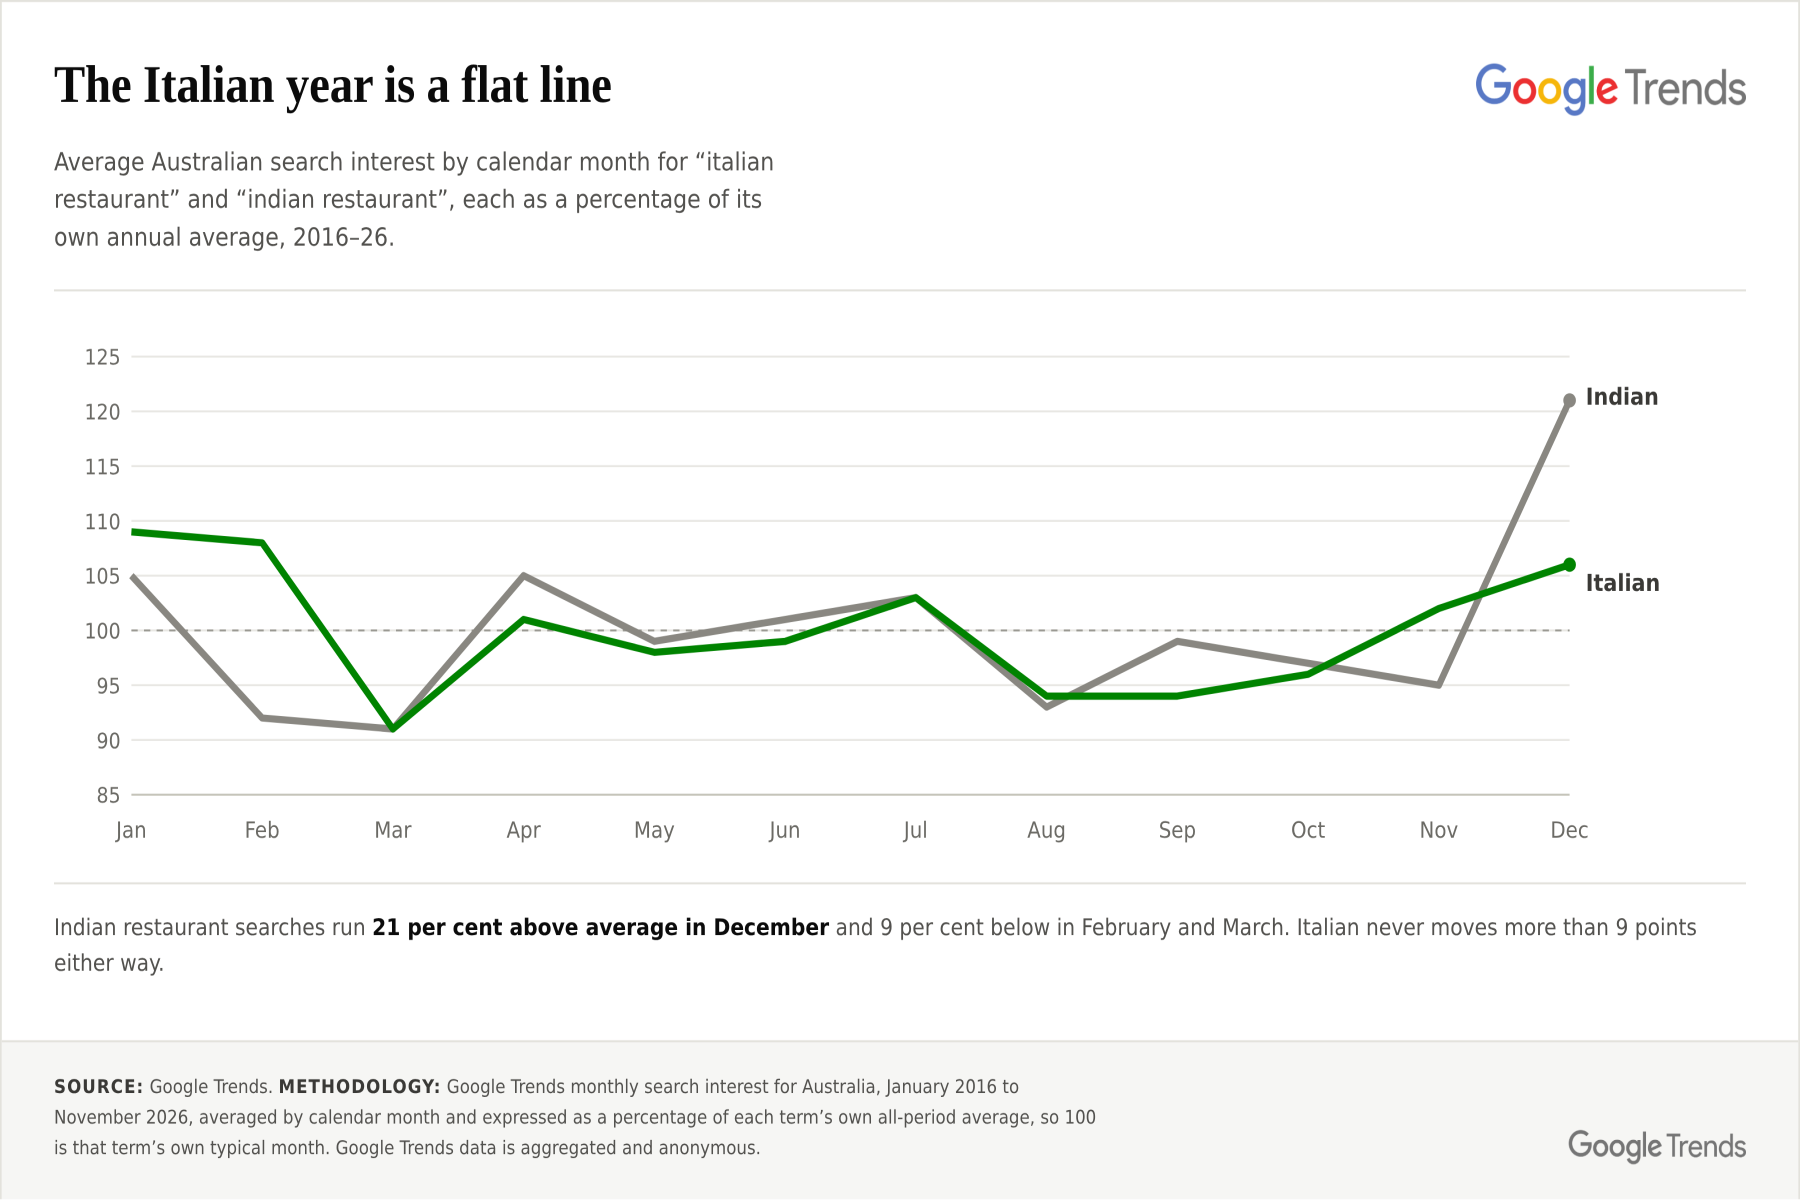
What differs is how violently. Indian restaurant searches run 21 per cent above their own average in December and 9 per cent below it in February and March — a swing of 30 points. Italian swings 18.
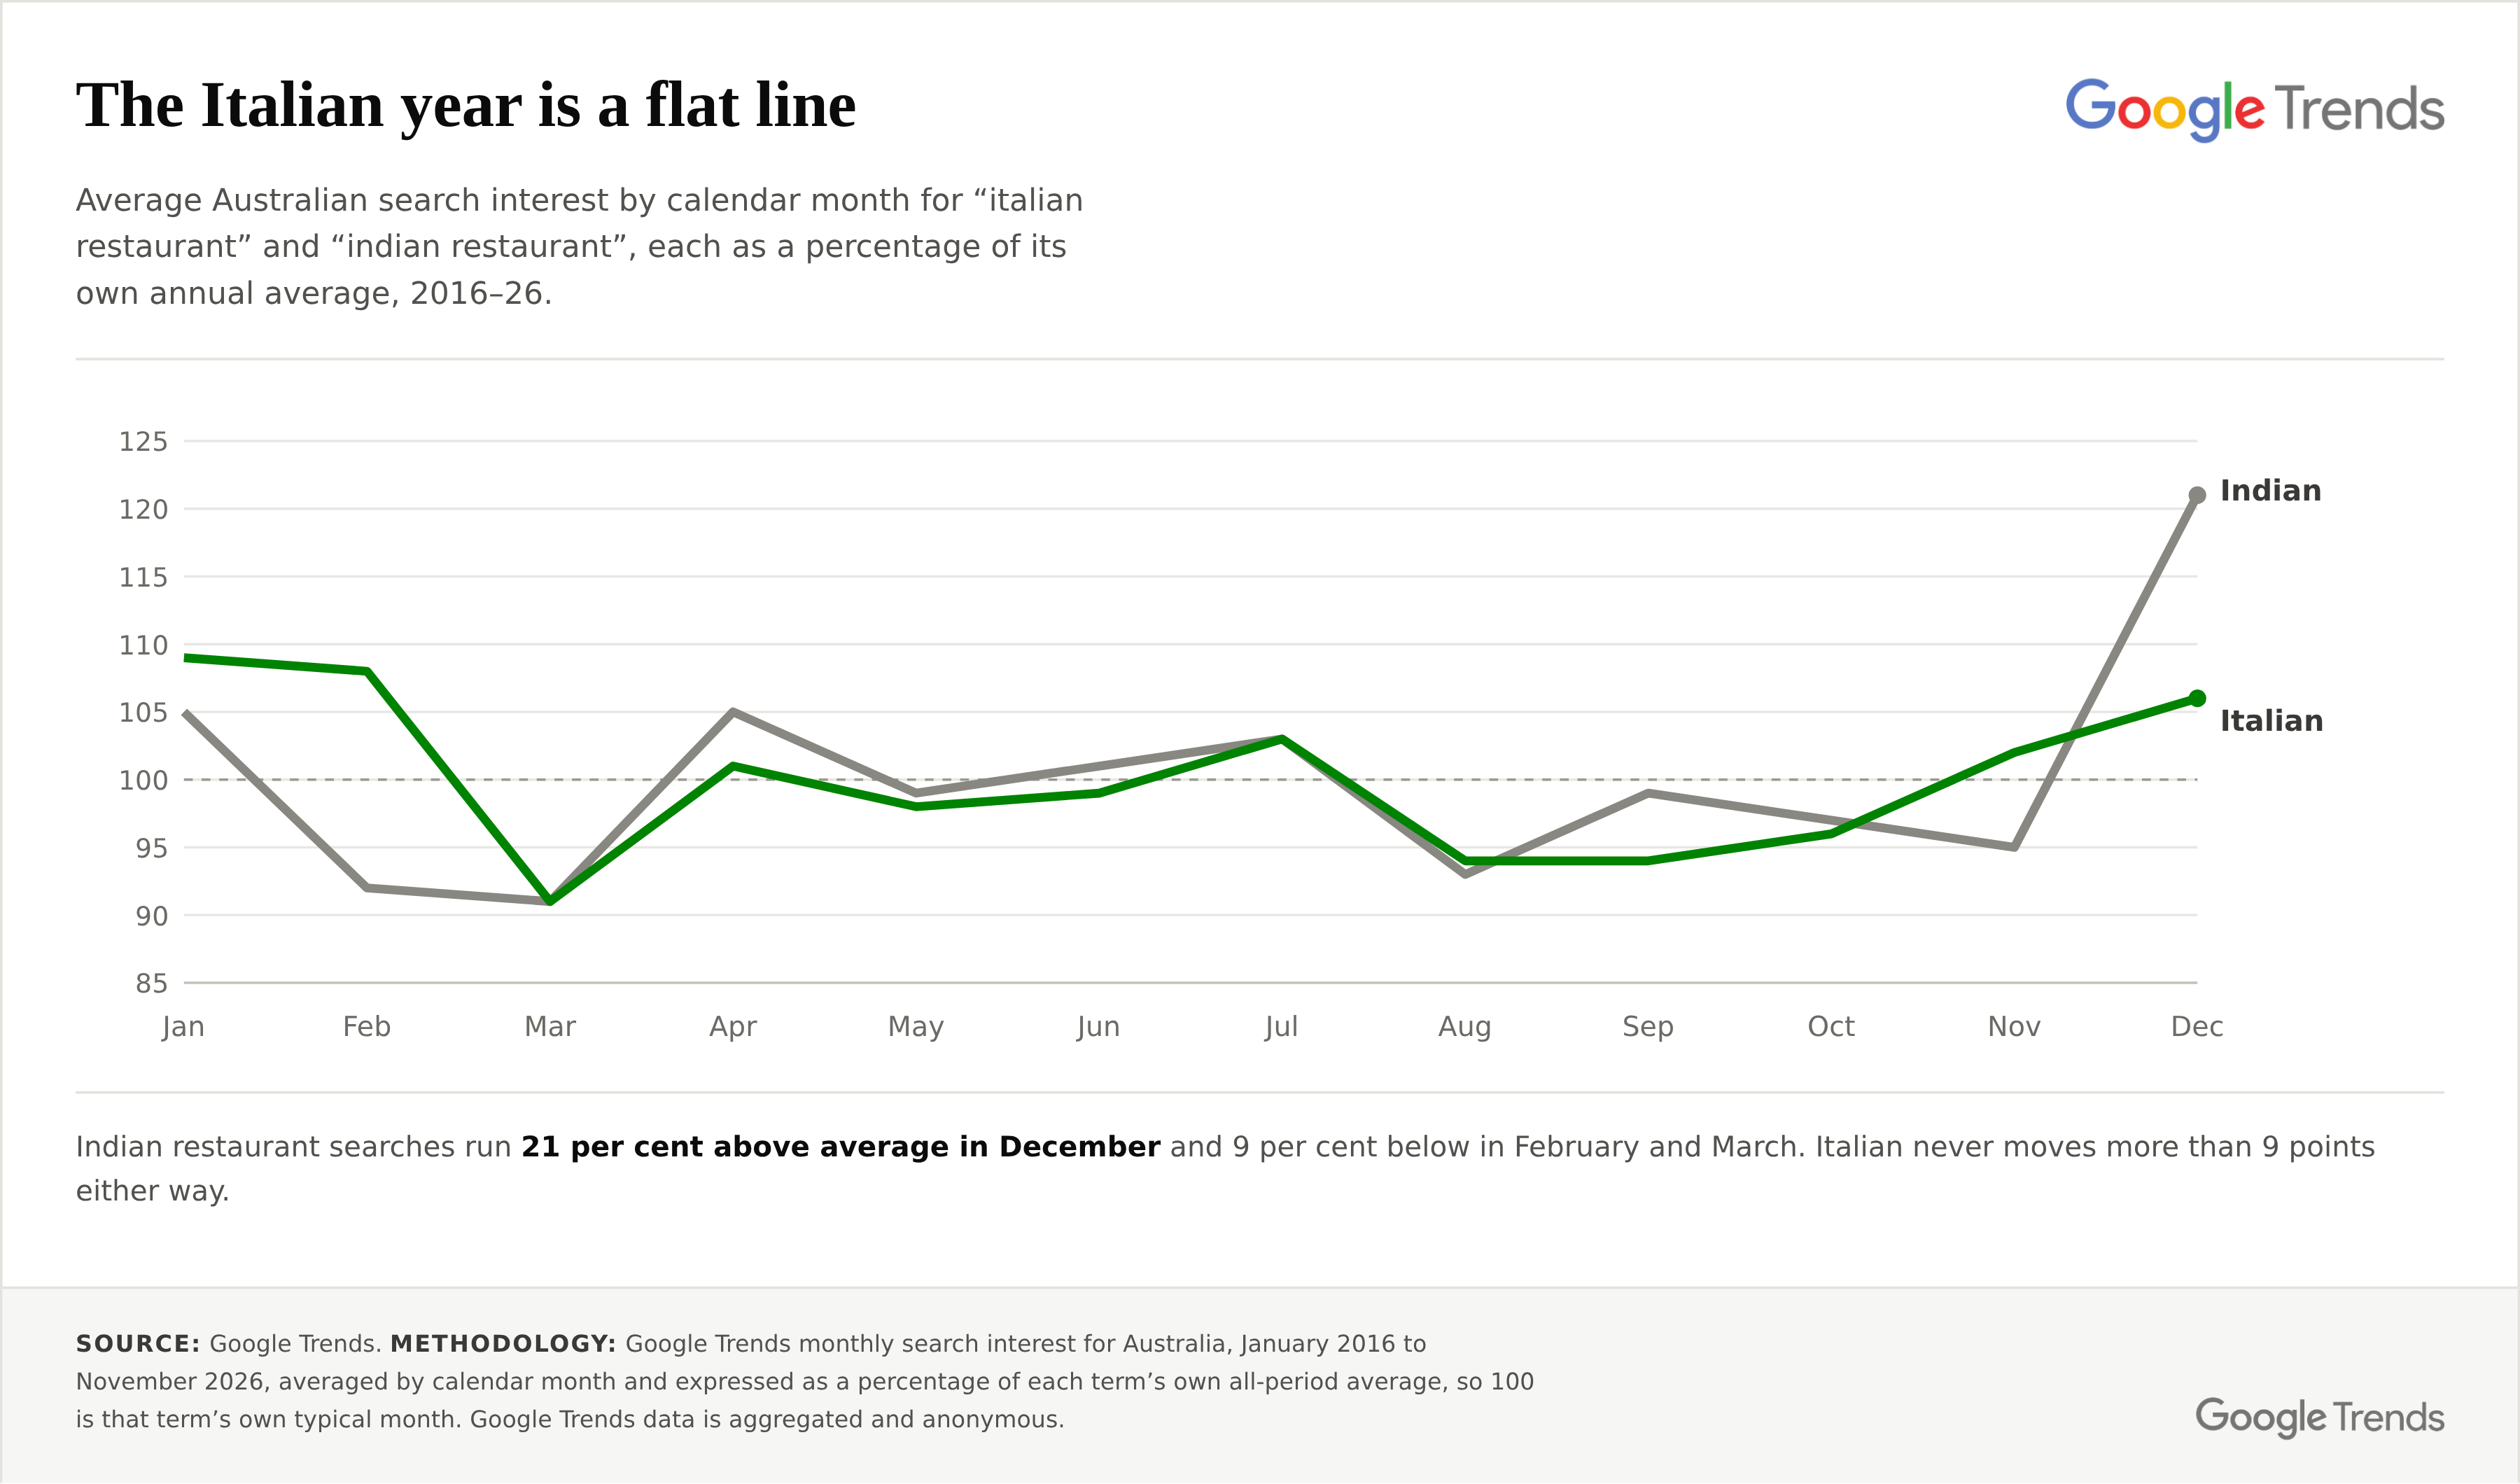
Figure 3: Average Australian search interest by calendar month for “italian restaurant” and “indian restaurant”, as a percentage of each term’s own annual average, 2016 to 2026. Source: Google Trends.
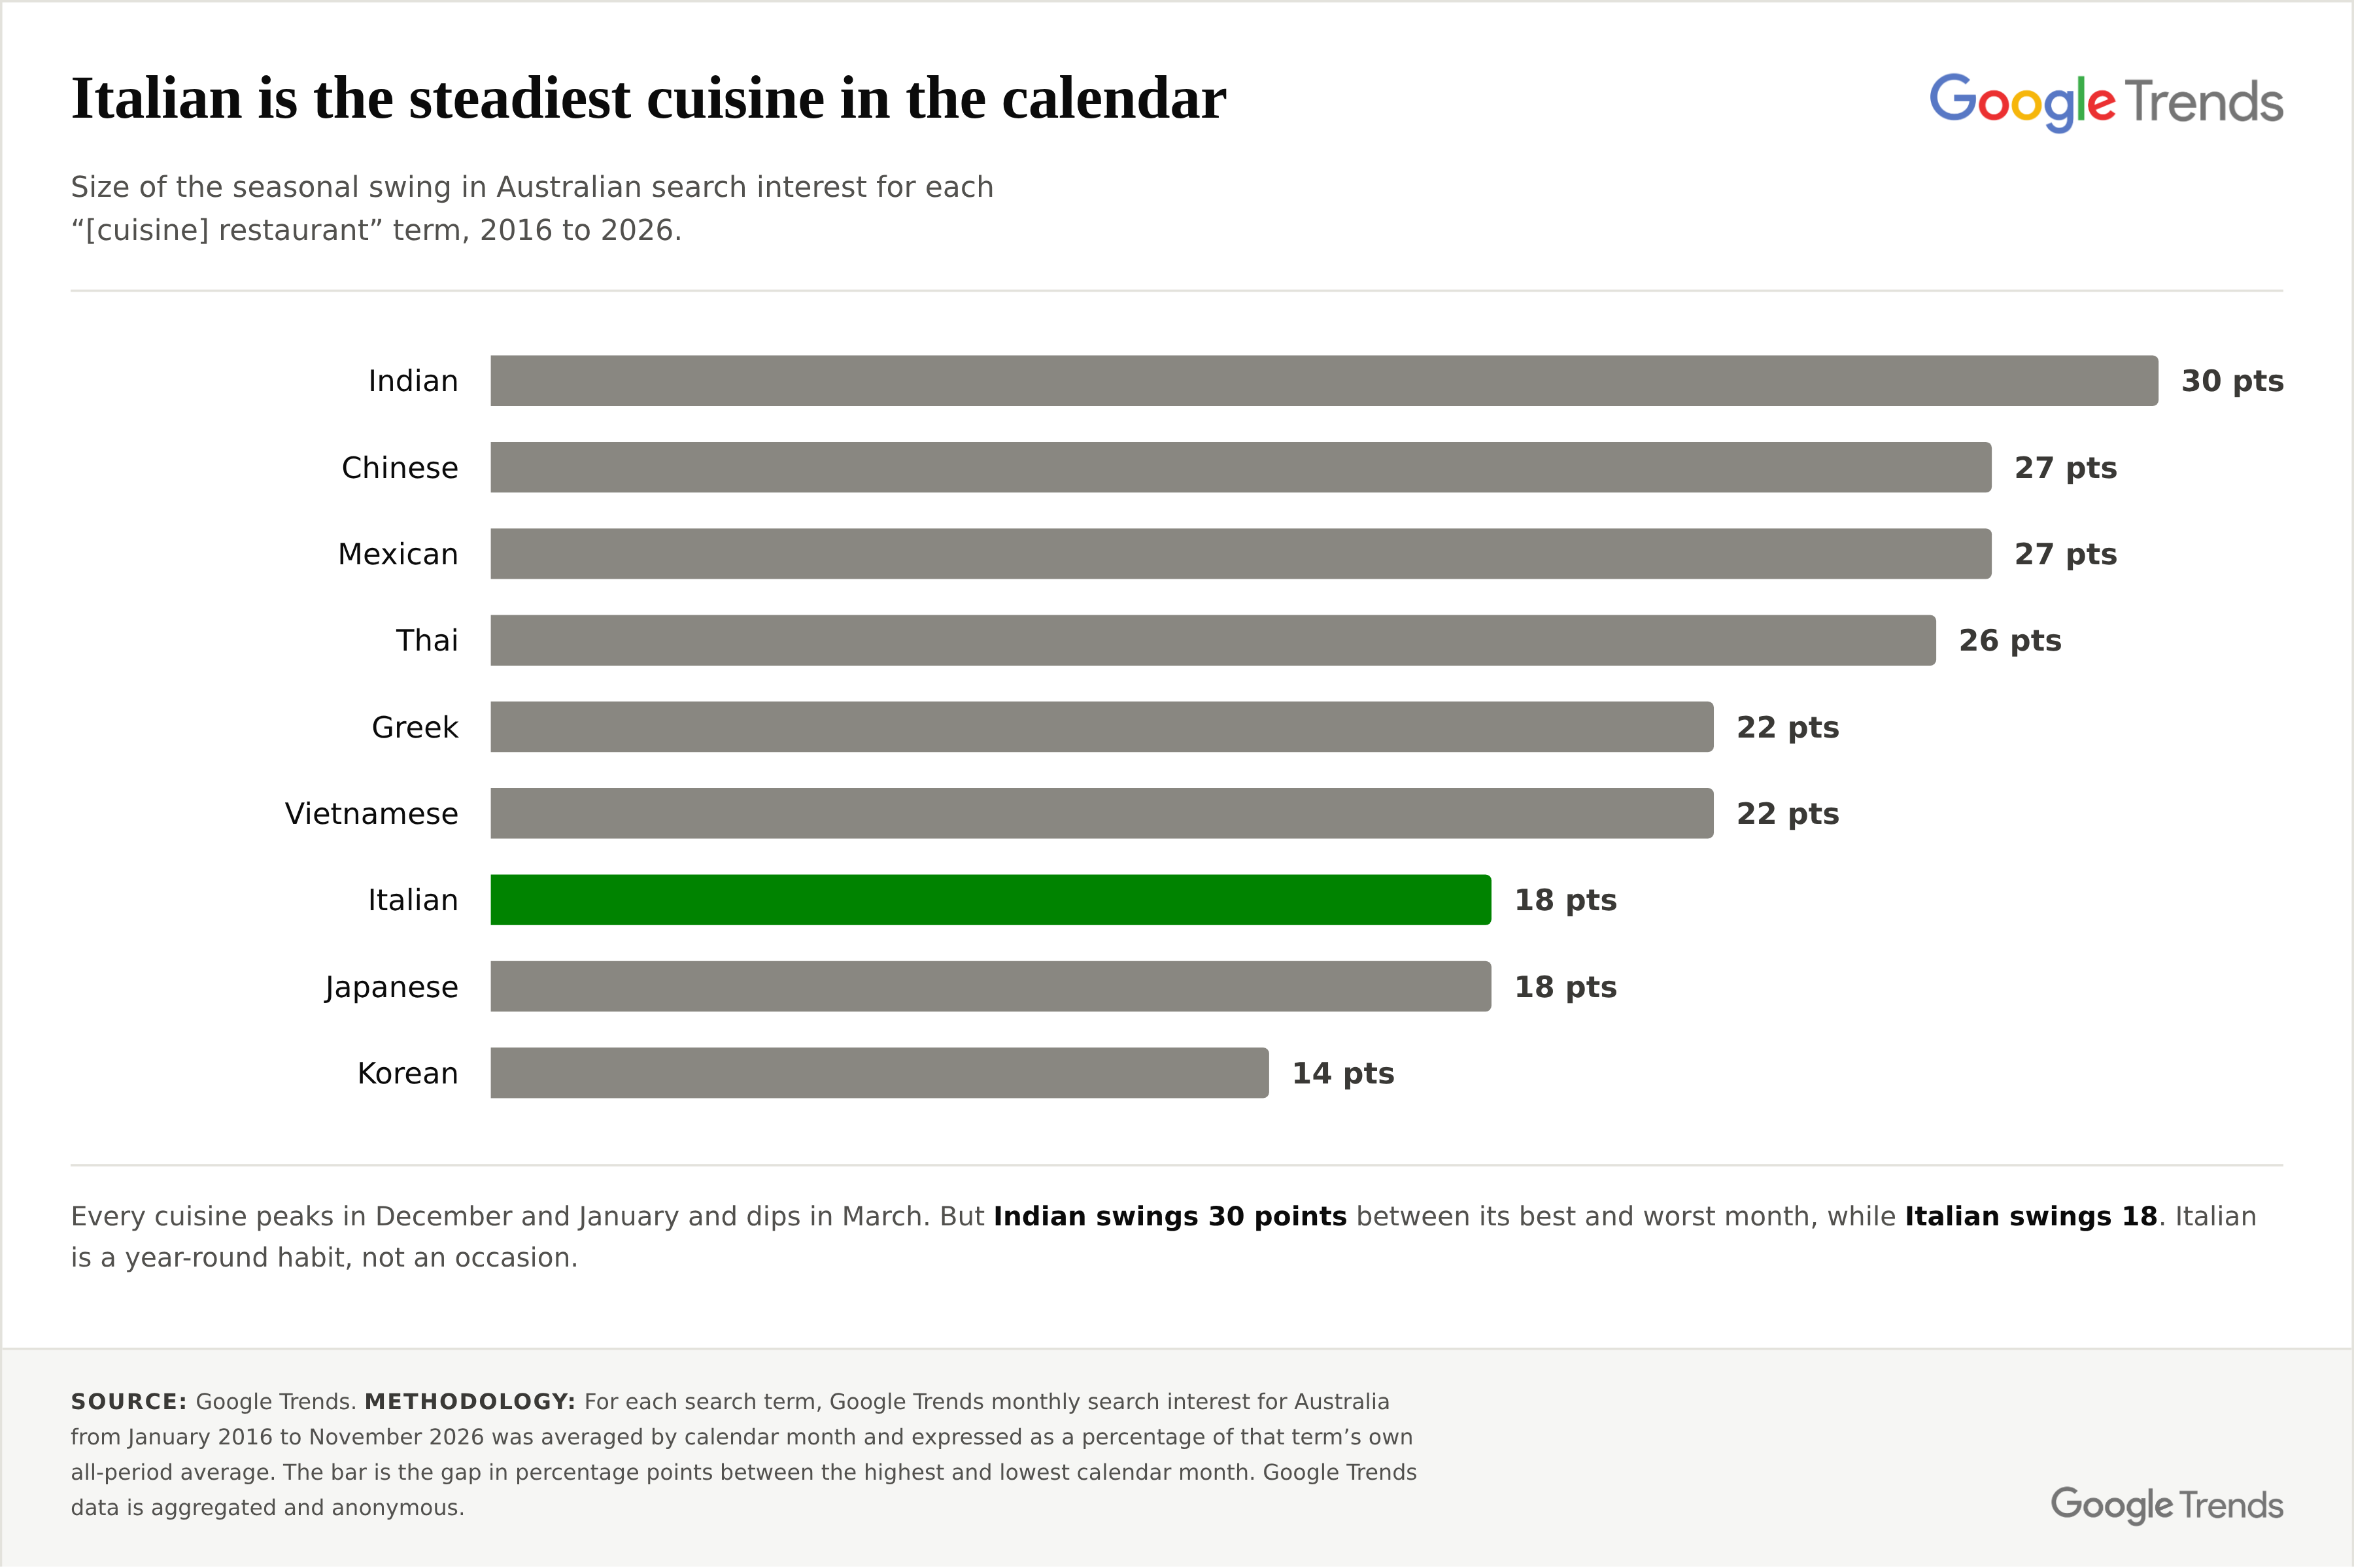
Ranked by the size of that swing, Italian sits near the bottom with Japanese and Korean. Indian, Chinese, Mexican and Thai are the most seasonal.
Figure 4: Size of the seasonal swing for each “[cuisine] restaurant” term, 2016 to 2026. Source: Google Trends.
The useful conclusion
A cuisine with a big seasonal swing is one people go to for an occasion. A cuisine with a small one is a cuisine people eat on a Tuesday. On that measure Italian is the most ordinary food in Australia — which, for the businesses that sell it, is the better outcome of the two. An occasion cuisine has to be chosen. A Tuesday cuisine is a habit, and habits do not need to be won back every December.
The same point explains the league table at the top of this article. Italian ranks fourth as a category because it has stopped being a category and become the thing you order when nobody can decide.
About the data
Figures are from Google Trends for Australia and were collected on 6 November 2026. Google Trends measures relative search interest on a 0–100 scale rather than absolute search volumes, so numbers can only be compared within the same chart. Nine “[cuisine] restaurant” terms were compared in two overlapping groups of five sharing “italian restaurant” as a common anchor, then joined on that term’s ratio between the two groups; figures for the second group therefore carry a wider margin of error. Seasonality was calculated by averaging monthly search interest from January 2016 to November 2026 by calendar month and expressing each month as a percentage of that term’s own all-period average. Search terms measure how people phrase a query, not how much food is sold. Google Trends data is aggregated and anonymous.